Tech Breakfast: Stratigraphic Visualization of Seismic Data - Jan 27th

ONLINE Only
Online Only, you must pre-register to receive access instructions.
NOTE: You Must Be Logged In to Register.
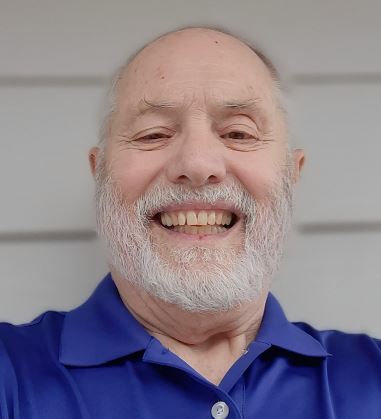
Speaker: Donald Vossler
This work attempts to solve the problem that seismic data is essentially a galvanometer measurement of acoustic energy transmitted through the earth. As such, geological structure is not immediately obvious. Instantaneous complex trace attributes are the basis for transforming the “galvanometer” values into a form useful as a visualization of subsurface stratigraphy that is faithful to the seismic data. A key element of this process is based on the assumption that seismic data is modelled by a normal distribution and therefore amplitude-based attributes such as energy, also are. Statistical normalization of the data (average and standard deviation) standardizes much of the interpretation process from data set to data set. The resulting data display has an appearance similar to a geological roadside cut. Automatic reflector picks are overlaid on the image for two reasons. First, it allows instant visual correlation with the original seismic display. Second, it allows direct visual cues to faulting. An interpreter can see lateral and areal changes easily in a visual context. Buried channels are both easy to recognize and to track. Fluid effects show up visually and gas often shows up as amplitude effects. Often, it is practical to track fluid effects away from a well. Proper visualization of lateral geological variation is key for improving planning.
Speaker Biography: Donald Vossler
Donald Vossler was born in Santa Fe, NM. He received his M.S. degree in geophysics from Oregon State University in 1967 and his Ph.D. degree from The Virginia Polytechnic Institute in 1972. After graduation he worked in the R&D department of Newmont Mining where he worked in mapping software development and application graphics support. In 1978 he joined the R&D department of Cities Service Oil and Gas. After completing initial assignments, he was put in charge of the company’s participation in the Conoco Shear Wave Project as chief analyst and software developer. Complete combined analysis of P and S wave usability was done with a practical application achieved. He then developed an advanced velocity analysis capability for the company. In 1982 he accepted an R&D manager position with Geosource for their color graphics development project which led to an industry first at the 1983 SEG. After the industry collapse (‘84-’86) he was hired by Landmark Graphics to head up their color graphics hardware project and later worked in workstation mapping development. He was hired away from Landmark in 1990 by Finder Graphics for a mapping development project. In 1992, Finder was bought out and he worked as an independent for six months and then worked for Larson Software Technology to develop their software rasterization capability. In 1997, he became an independent software consultant and spent several years consulting, primarily for Seismic Micro Technology where he developed their contour mapping capability and their fault management system for the workstation. In 2002, he returned to full time consulting and retired in 2006.
** Access information will be sent to all registrants after registration closes.
Price List:
|
Pre-Registered |
Member
|
Free |
| Non-Member |
$10 |
** Please be aware that ALL registrations must go through 'Checkout', even if your total is zero. Registration is not confirmed until you complete the checkout process.